
The Physics of Weight Loss and Sustainable Weight Management
You Get Fat Because of Very Complicated Biology
You Get Thin Because of Very Simple Physics
But Staying Thin is a Combination of Biology and Physics
Note: This material is supported by many scientific references I have not listed. I provide selected links to original papers where I am sure no copyright issues. Unfortunately copyright issues for government funded research are not clear and one often must pay $35 for a journal article. Most of the figures are my own, or licensed for my use. I will eventually place original journal references, but references are not much help without original article.
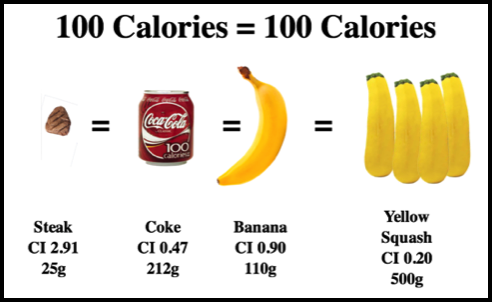
Food is food and when losing weight a calorie is a calorie - it is physics not biology.
When your gaining weight a calorie may not be a calorie - You can have good and bad calories, and strange complex differences can occur between different individuals. However when you're losing weight you have to treat a calorie is a calorie.
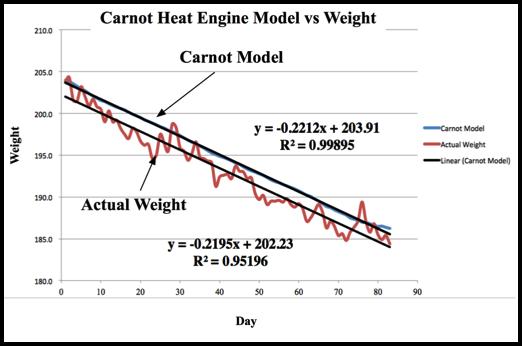
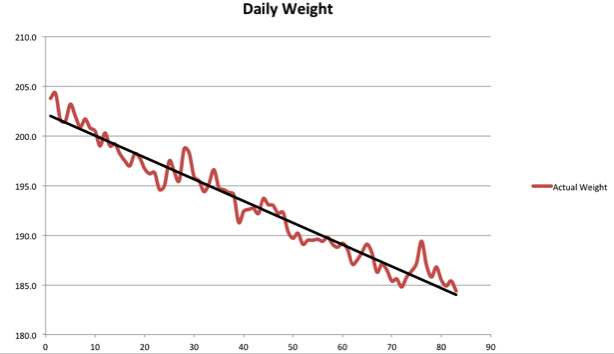
Losing weight is hard work, and can be discouraging, The graph you see below to left, is my weight over 90 day period. The red line is based on my weight taken on an accurate bathroom scale, every day between 5AM and 6AM, the lower black line is best fit to my weight and the upper black line is what the Carnot thermodynamic model predicts my weight should be based only on calories in vs calories out - nothing else. I just tracked calories nothing else. The shift up on the model is probably tied to inefficiency and energy associated with digestion (Dietary Induced Thermogenesis - DIT see below), it is the cost of digestion.
For the record, I was shocked at the accuracy of the model on-the-way-down - I did not expect or even hope for a strong correlation. Also for the record now that I am in maintenance mode for well over a year, it is much harder to predict weight with the Carnot model in maintenance mode. I think I know why, but will save that discussion for later.
That graph on the left and the well publicized McDonalds Diet (School Teacher 37 lbs Lose 3 Months Eat McDonalds) and the scientific literature (see Strychar 2006 , Freedman et. al. 2001 Katz 2014) all confirm that a calorie is a calorie on the way down. They all confirm that if you want to lose weight 100 Calories = 100 Calories no matter what the source, Again, that is not true if you want to gain weight.
When your gaining weight a calorie may not be a calorie - You can have good and bad calories, and strange complex differences can occur between different individuals. However when you're losing weight you have to treat a calorie is a calorie.
Losing weight is hard work, and can be discouraging, The graph you see below to left, is my weight over 90 day period. The red line is based on my weight taken on an accurate bathroom scale, every day between 5AM and 6AM, the lower black line is best fit to my weight and the upper black line is what the Carnot thermodynamic model predicts my weight should be based only on calories in vs calories out - nothing else. I just tracked calories nothing else. The shift up on the model is probably tied to inefficiency and energy associated with digestion (Dietary Induced Thermogenesis - DIT see below), it is the cost of digestion.
For the record, I was shocked at the accuracy of the model on-the-way-down - I did not expect or even hope for a strong correlation. Also for the record now that I am in maintenance mode for well over a year, it is much harder to predict weight with the Carnot model in maintenance mode. I think I know why, but will save that discussion for later.
That graph on the left and the well publicized McDonalds Diet (School Teacher 37 lbs Lose 3 Months Eat McDonalds) and the scientific literature (see Strychar 2006 , Freedman et. al. 2001 Katz 2014) all confirm that a calorie is a calorie on the way down. They all confirm that if you want to lose weight 100 Calories = 100 Calories no matter what the source, Again, that is not true if you want to gain weight.
Many of the trendy hot diets claim that you can have good and bad calories. The biology of obesity is a complex matter. Little doubt that on-the-way-up gaining weight is all about that complex biology, and a calorie of coke may not be equal to a calorie of yellow squash. However, reversing that biology to lose weight is just not the answer. On the way down what you see in this figure is the a safe worst case caloric assumption and supported by all science published over the last 25 years.
The Biogimick Diets
Diets based on Glycemic Index, vegan only, protein only, no alcohol, Weight Watcher points, other preferred metabolic routes, prepackaged meals, or pills that suppress hunger etc.. simply have not delivered long term successes. Most diets attempt to reduce caloric input so it is painless with "biogimicks" - you can and do lose weight, but these diets all end up as calorically reduced diets, but the bad news is 85% of the biogimick dieters regain that weigh back within five years (see Ikeda et.al for Review) and about 50% within two years (see Anderson). That is because they did not learn how to manage weight on way down, and still own all old habits. Most people underestimate calories of a meal, or have no caloric awareness and that is why they over eat (see Lansky et.al) and why they do not have skills to manage weight after loss, Hundreds of good scientific references that constantly show only thing that does work is Rule 1 - "Eat less than you burn" (see Freedman Review) and ………
Key to Rule 1 is to be able to answer big question one "How do you know how much you eat" - That requires portion control expertise and Cal-Index with a Personal CPT built into your head, so you always know how much you eat. You have to become Calorically Calibrated - you become a Carnot Black Belt Ninja. These "on-the-way-down" Carnot Ninja habits and lessons are important to both lose of weight and maintenance of weight after you hit weight goal. They are critical life-long habits.

Why is drinking water and other liquids so important during serious loss of weight ?
All diets say you should drink as much water and other liquids as possible, at least 8 liters a day -- but never tell you why.
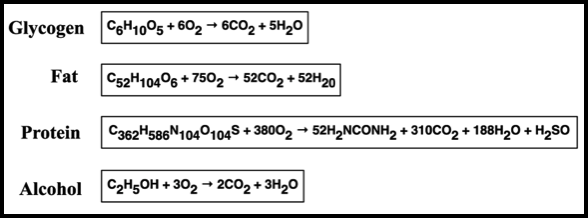
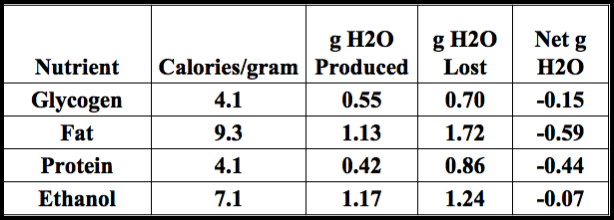
In Desert Animals a book published in 1964, Schmidt-Nielson speculated that the camels hump keeps fat reserves that can be used to produce metabolic water when the animal had no water (see Candlish). Schmidt-Nielson forgot that to metabolize fat requires massive amounts of oxygen and that this oxygen requirement, leads to water evaporation from the lungs (see table to the left). As a result the metabolic pathway for fat leads to a significant net water deficit.
Here is the major problem; if your body does not have water stores it will shut down fat metabolism - in other words you stop losing weight from fat, and go to muscle even if your on a calorically reduced diet. The good news is Ethanol is essentially water neutral so does not contribute to the water problem. In fact 88% of a glass of wine is water based so helps with water balance.
Key, it is very important if your on a serious weight loss diet to drink as much water and other liquids as you can to support this important lipid (fat) metabolic pathway that produces a water deficit.
I find carbonated zero calorie drinks help suppress hunger and make sure never get into a water deficit state. I make my own carbonated green tea with no sweeteners (taste like beer) and is a real kicker pick-me-up drink in afternoon.
I find carbonated zero calorie drinks help suppress hunger and make sure never get into a water deficit state. I make my own carbonated green tea with no sweeteners (taste like beer) and is a real kicker pick-me-up drink in afternoon.
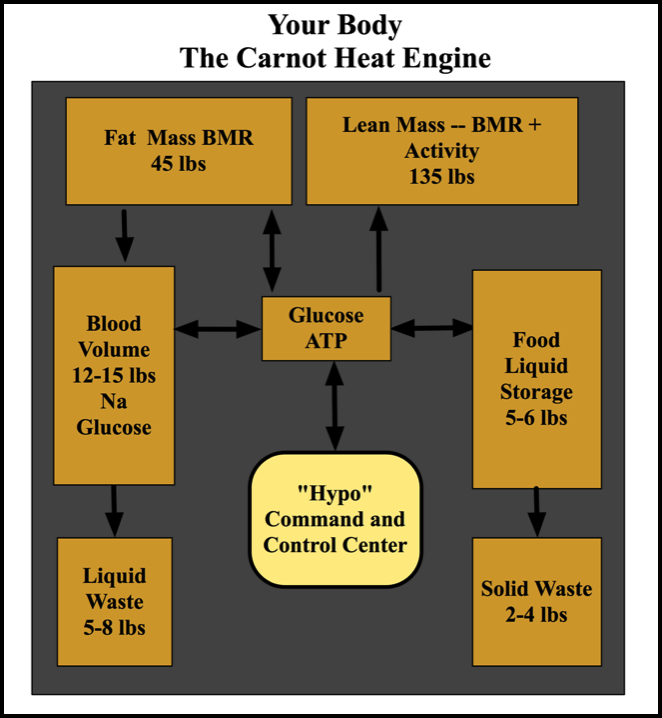
Compartments That Change Your Weight
The graph you see below is my weight over a 90 day period. The red line is based on my weight taken on an accurate bathroom scale, every day between 5AM and 6AM, the black line is a best fit linear line of the red line.
The graph you see below is my weight over a 90 day period. The red line is based on my weight taken on an accurate bathroom scale, every day between 5AM and 6AM, the black line is a best fit linear line of the red line.
You can see my weight constantly goes up and down. That can be very discouraging especially at the start of any diet program. The diagram on the left explains why your weight fluctuates so much day-to-day and throughout the day. That is why we include a 10 day total for weight loss in the Joule log. Can divide by 10 in head and see average per day progress, but also see how much total lost over 10 days - it is a moving average.
Hundreds of published scientific studies have quantified these volumes and weights over time and how they can be altered. When you get on the scales in the morning your weight is the sum of what you see. If you have scales that provide a fat reading (e.g.. Withings or Aria WiFi Scales) that is estimated by measuring the resistance between your left foot and right foot, when you stand on the scales. Fat has much higher resistance that lean mass or liquids and as you lose weight it will change, however the fat scale is +- 10% and biased by blood volume, waste volume and Food Storage volume- still useful. Many other ways to measure Fat Mass (see below), probably the best way is tracking waste, abdomen, hips and neck dimensions with a digital tape measure (see Carnot Gear). Depending weather you are a male or female, the US Navy (see page 13) has calibrated a set of simple equations that take those measurements and provide Fat Mass +- 1%.
Salt intake (Na) can swing you weight by several pounds. Your Kidneys will maintain a constant Na concentration in Blood compartment. Glucose however will go up and down all day as you eat carbohydrates, and the Command and Control Center (managed by the Hypothalmus) will mange the glucose concentration in the blood. As you lose fat mass you also end up with a net water deficit (see below) that can be dangerous, so it is important on any diet to drink fluids all day long. That means your blood volume may move up and down several pounds a day. In 1963 Finlayson et. al. (see Finlayson) showed that blood volume changes from 4.5% to as much as 16% throughout the day, in normal male volunteers, or about 0.5 to 2.5 lbs per day.
Salt intake (Na) can swing you weight by several pounds. Your Kidneys will maintain a constant Na concentration in Blood compartment. Glucose however will go up and down all day as you eat carbohydrates, and the Command and Control Center (managed by the Hypothalmus) will mange the glucose concentration in the blood. As you lose fat mass you also end up with a net water deficit (see below) that can be dangerous, so it is important on any diet to drink fluids all day long. That means your blood volume may move up and down several pounds a day. In 1963 Finlayson et. al. (see Finlayson) showed that blood volume changes from 4.5% to as much as 16% throughout the day, in normal male volunteers, or about 0.5 to 2.5 lbs per day.
DIT, Diets and Alcohol
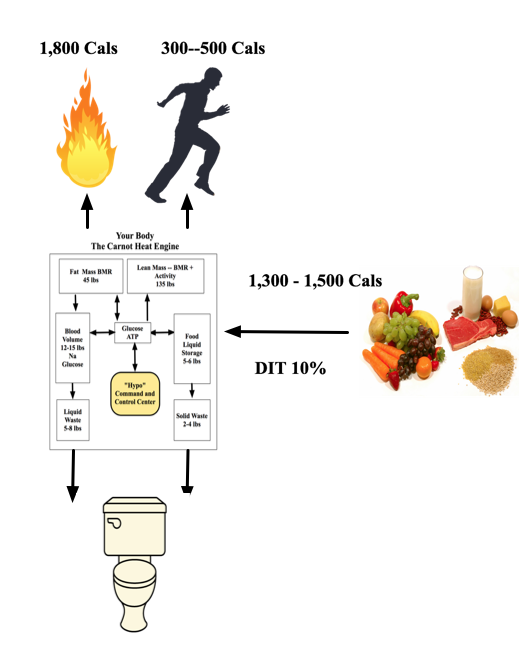
The diagram on the left is our schematic of what goes on in your body each day, and all of compartments responsible for your weight changes day to day.
I have assumed a 205 lb human. The most important weigh compartment is the 45 lbs of Fat Mass, the Lean Mass (muscle) is 135 lbs. In a typical day a person who weighs 205 lbs will eat at least 5 lbs of food and that makes your weight go up 5 lbs until it is digested metabolized and both liquid and solid waste are eliminated.
We have added DIT of 10%
DIT = Dietary Induced Thermogenesis represents the metabolic cost of digestion. On average it is 10%. It is 0 to 3% for fat, 5-10% for carbohydrates, and 20 to 30% for protein. Many diets jump on DIT differences between nutrients as the solution to fast weight loss. For example since DIT for protein is higher than for carbohydrates, many bio-gimick diets recommend eat protein and no carbohydrates. Same is true for dietary fiber has essentially 100% inefficiency - dietary fiber never gets digested. These selective content diets have not worked so well (see Diet Tab) and end up being calorically reduced diets, if they do work and most all usually lead to all weight regained within 1-5 years.
We don't even remove dietary fiber from CI calculations based on DIT, for very high CI foods and high fiber content foods (Quest Bars), it is not necessary or fair to remove for vegetables or fruits. The DIT is free heat and reflected in shift of model predicted weight and actual weight at top of this page. However, again the science has shown repeatedly that DIT is not a major contributor to weight loss; major loss is only due net net to total caloric reduction of intake.
Some good news alcohol has a variable DIT of 10% to 30% similar to protein. The evidence is that "alcohol intake does not systematically increase body weight" (see Westerterp 2004 page 3 for summary and references), although some earlier studies suggest it has a lower DIT of 5% (see Weststrate et. al. 1990 ). Alcohol has no long term storage compartment so it is immediately metabolized. No good evidence that alcohol consumption contributes in any special way to increased body weight. (see below for details).
In addition, alcohol may influence appetite. White wine sure suppress my appetite, but the science on appetite suppression benefit is very weak, and several studies suggest that it enhances appetite (Yeomans et. al. 2003 Poppitt et. al. 1996); i.e. makes you eat more. In contrast Calissendorff 2008 demonstrated that alcohol transiently inhibits both ghrelin and leptin. Ghrelin is hormone produced by stomach and is likely the substance that gives you acute "hunger pains". Leptin suppresses appetite but is more likely a long term regulator of fat balance, over short term trigger of eating or not eating (for review see Klok et. al 2007).
We allocate full caloric content of any alcoholic beverage in Joule. I did not reduce my wine intake at all during my weigh loss. Wine and beer have a 10-12% alcohol contribution to Thermogenesis and a 90-88% carbohydrate contribution tied the non-alcoholic component. A Cal-Index of 0.80 seemed to work in my own weight loss program.
How to Calculate Basal Metabolic Rate (BMR)
The Basal Metabolic Rate is simply the number of calories you burn each day just to maintain your basic metabolism and heat your body. It's is a very important number that can vary based on age sex, weight and height. It can be measured directly in any pulmonary lab using indirect calorimetry (see Harvey) - measuring ratio of oxygen consumption s versus carbon dioxide production. It can also be measured directly by measuring heat production over time in special enclosed rooms or a bath.
A Number equations can be found that claim to calculate BMR based on your height, age weight and sex. The Scohfiled equation is used by many, but the most common is Harris-Benedict equation that uses sex, weight and height. in 1990 Mifflin et. al. carried out a comprehensive study and developed the most accurate equation that we use in Joule. We use the most conservative value. You can find web sites that use all three but cross-check with this equation:
9.99 x weight (kg) + 6.25 x height (cm) - 4.92 x age (y) + S
Females S = -161
Males S = +5
If you over estimate BMR you will also likely over eat. It is better to assume a low value over a high value. Wikipedia has a good BMR Page summarizing these equations and history.
Licensed to use figure from N AT U R E | VO L 4 9 7 | 2 3 M AY 2 0 1 3, Copyright © 2013 Macmillan Publishers
What is Your Target Weight, How Much do Your Want to Weigh, How Long Do You Want to Live ?
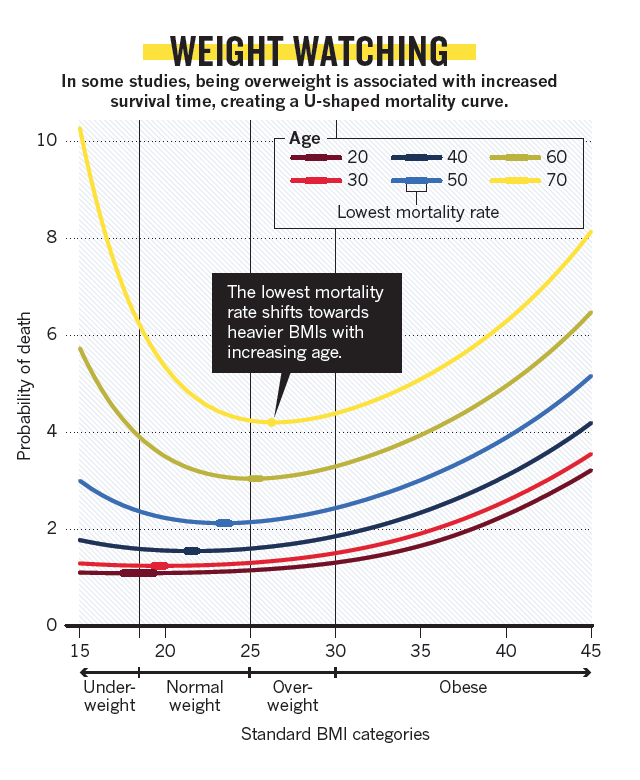
Answer - it depends on your age and how long you want to live. Thin is not always healthy. Several excellent summary articles have been recently published that show might not be so bad to have a bit of fat. It is not healthly to be obese or too thin. As you get older curve gets steep (see Hughes) and figure to left. The figure shows Probability of Death vs Body-Mass-Index or BMI (see review Ahima et. al. 2013)
The BMI is a measure of obesity based on your height and weight. It is defined as weight in kilograms divided by your height in meters squared and is considered the reference for obesity, In general a BMI of 19-25 is considered normal, 25- 30 is overweight and above 30 is obese. My target was to reach and maintain my weight so I am at a BMI of 24. Worth reading and based on age pick a target weight, may not be bellow a BMI of 25, up to you.
My view it is important to be healthy and weight is the major part of that equation, but important to pay attention to other contributors to the health equation as well after you hit target.
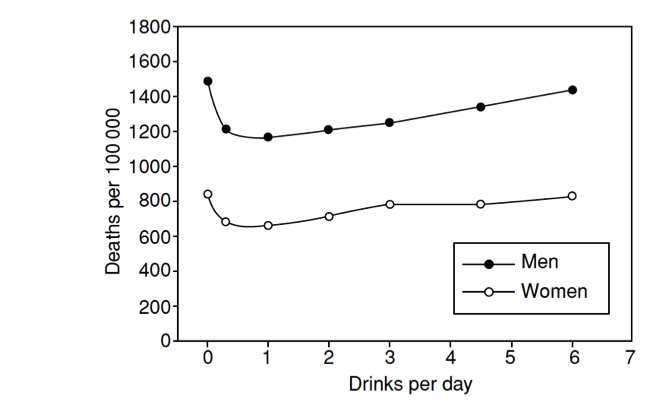
License 3638760104677 to use figure from Elserver Ltd, from Encyclopedia of Food Sciences and Nutrition, Benjamin Caballero,S.L. Talcott, Wines: Dietary Importance Pg 6209.
What about Wine Beer and Alcohol ?
Alcohol usually comes with other things (grape juice hops water) and together they create a caloric load like any other drink. But Alcohol is processed though complex metabolic pathways that do not lead to lipid storage - it does not make you fat.
Wine has a Cal-Index of 0.80 and a 4 Oz glass of wine is 112 g. That means it is really 90 calories. Just no science anywhere that supports treating alcohol special over fats carbs or protein - none (see Calissendorff 2008, Weststrate et. al 1990 for reviews). The metabolic path for alcohol is very complex and does not go to adipose tissue easily. If anything the literature suggests maybe significant diet-induced thermogenesis (DIT) that means significant energy is required to digest so Cal-Index for wine may actually be less than 0.80. The DIT issue is controversial so we assume 0.80 its true caloric content. No one has ever claimed ETOH leads to a higher Cal-Index or somehow can make you fat - ETOH is just another calorie, a source of energy, and the science does not even suggest it stimulates your appetite to eat more. Actually, it appears may suppress appetite to eat less ( see Calissendorff). Either way with Carnot you should be portioned controlled anyway on other food so ETOH should not play a roll in food quantity or diet content, just include in your calories.
In fact red wine appears to extend you life. Graph on left shows a J shaped curve and with 2-3 150 ml (450g total) you live longer than someone who does not drink. (see Caballero et. al.). More on this later.